- ·Day 57 of a 22-day median market in your area
- ·No showings this week (5 total)
- ·Homes in your area are selling at 98.6% of list price
- ·Nearest active competitor is $755K — $5K above you
Where buyers are finding your home.
No showings were booked this week.
Patterns from showing feedback — what buyers keep noticing.
This was your strongest week on the market yet. The price improvement took hold — online views climbed and four new showings brought your total to 18 — and feedback keeps pointing to the kitchen and natural light. A comparable nearby just went conditional, which only adds pressure on buyers. My focus this week is turning that interest into an offer.
Online interest is strong but it isn’t converting to showings — that usually points to the price band or the photos, not the home itself.
No comparable homes nearby changed status this week — your competitive set held steady.
What this means: Your area is a seller's market — homes are selling in about 22 days, at 98.6% of asking, with 2.8 months of inventory, which keeps pricing power on your side.
Your home is priced 2nd of 4 comparable homes on the market — buyers weigh you against these directly.
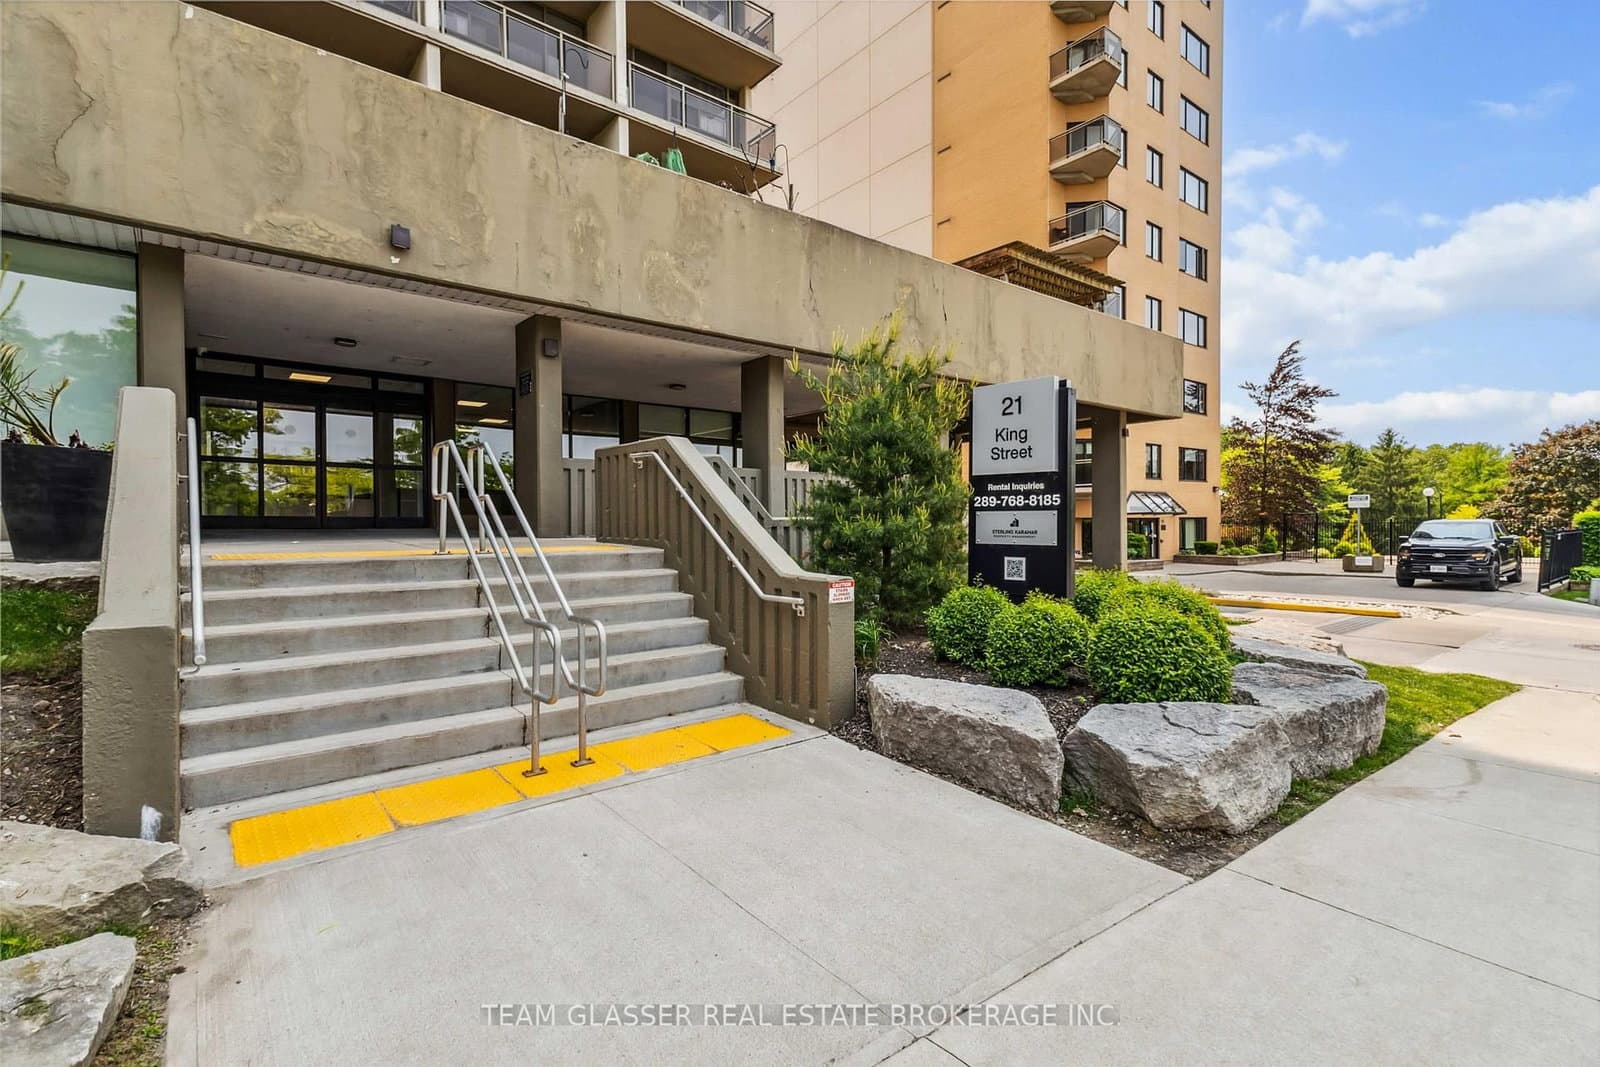
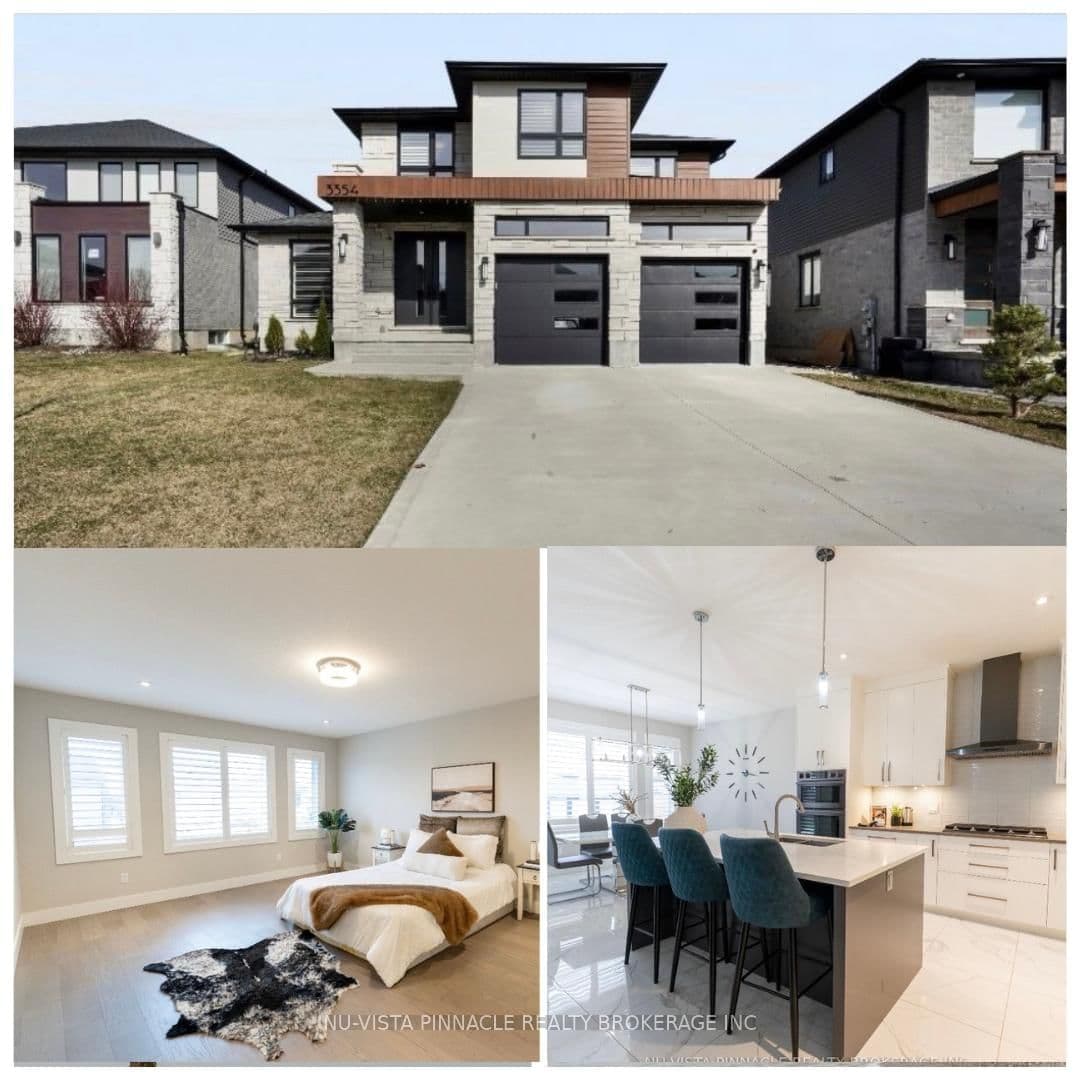
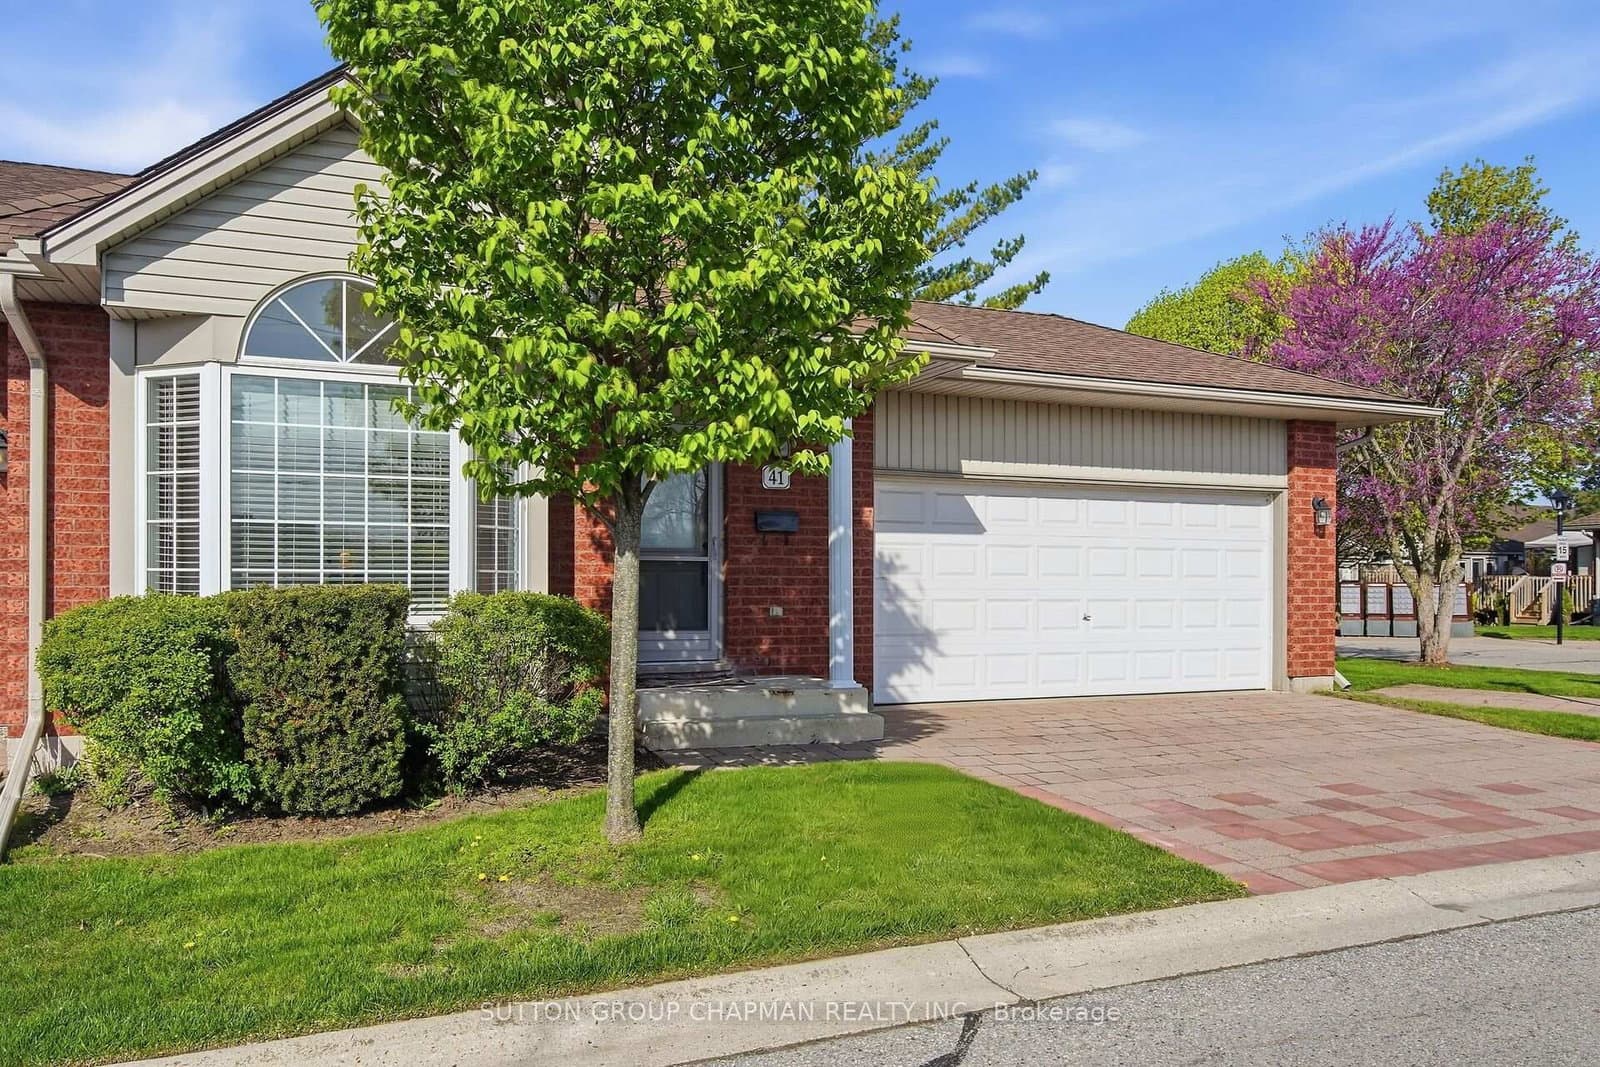
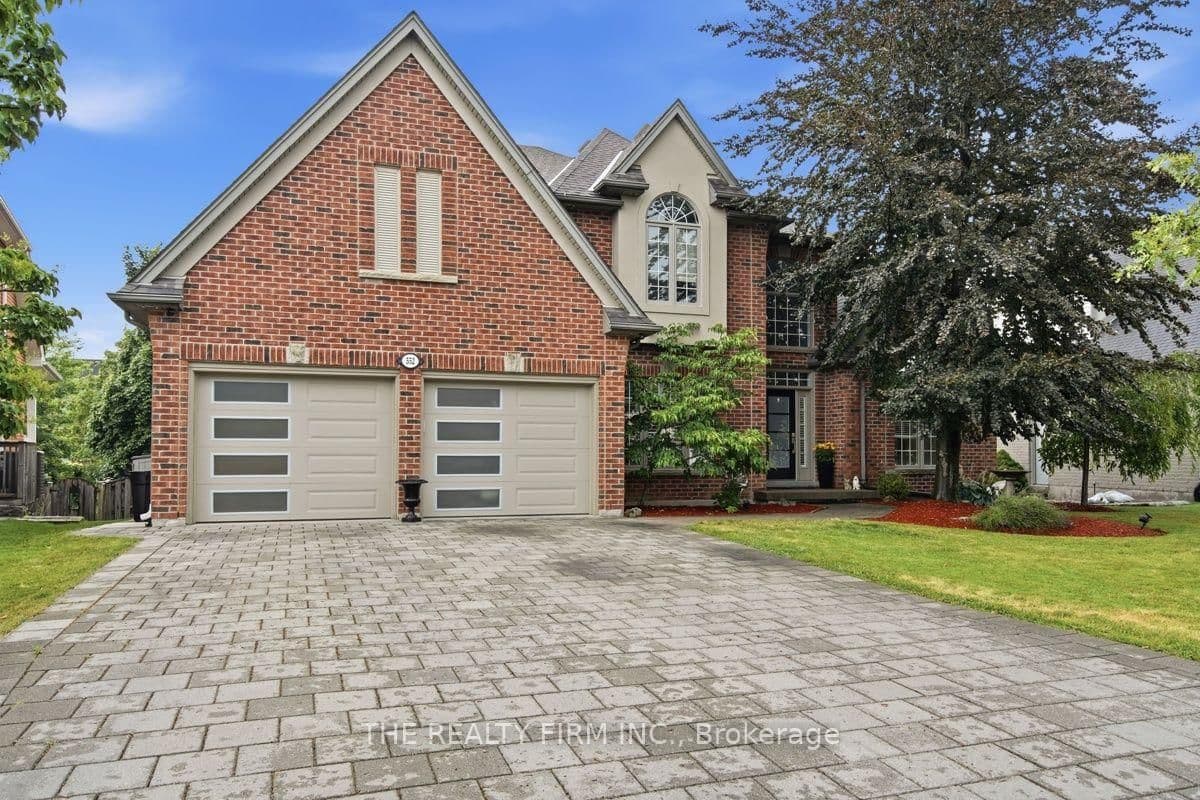
Nearby sold comparables averaged $744,500 in 13 days — you're listed at $749,900, day 57.
Marketing continues as planned — watch this space for the next scheduled step.
Questions about your week or what’s next? I’m one tap away.